 Ethereum
 XRP
 Solana
 BNB
 Hedera
 Cardano
 Chainlink
 Dogecoin
 Litecoin
 Shiba Inu
 Stellar
 Pepe
 Bonk
 Sui
 Ondo
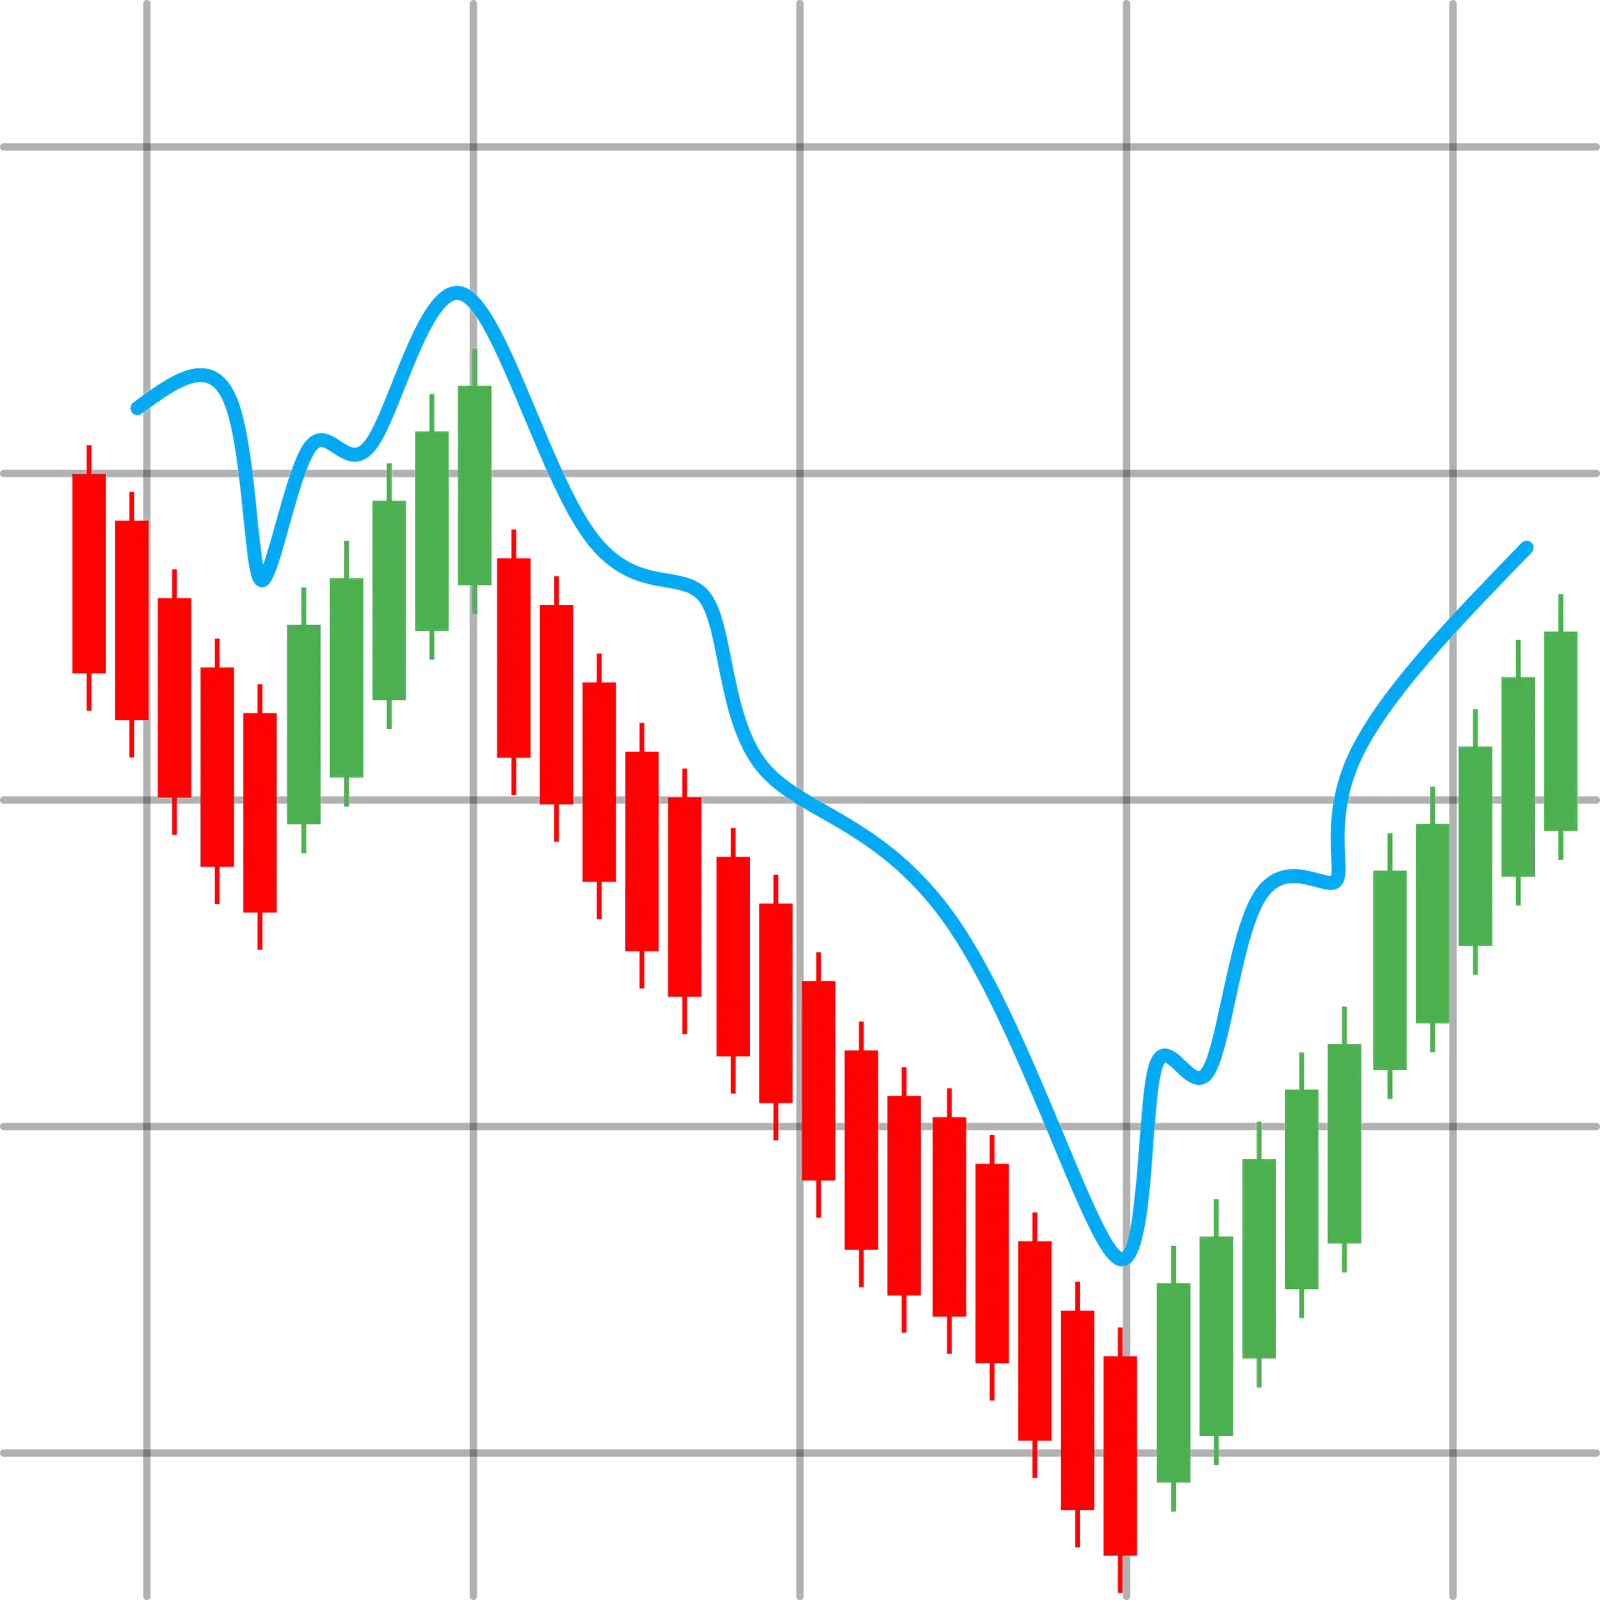
The Bitcoin 4-year cycle is the most quoted pattern in crypto. Every time the halving cuts new supply in half, the market has eventually delivered a big rally, a painful crash and a slow rebuild, roughly once every four years. Traders plan around it, skeptics call it astrology, and the truth sits somewhere in between.
This page walks through the halving mechanics, puts every cycle since 2012 side by side with sourced numbers, and asks whether ETFs and institutional money have changed the rhythm. Then it looks at what the pattern implies for the run-up to the next halving, expected around April 2028.
- Four halvings so far (2012, 2016, 2020, 2024); each was followed by a cycle peak 12–18 months later.
- Gains shrink every cycle: roughly 575x from low to peak in the first cycle, about 8x in the latest one.
- Bear-market drawdowns are shrinking too, from about 86% after 2013 to roughly 54% (so far) after the October 2025 peak.
- The next halving, around April 2028, cuts the reward from 3.125 to 1.5625 BTC. Our model’s 2028 average sits at $137,890.
What Is the Bitcoin 4-Year Cycle?
Bitcoin has no central bank. Its supply schedule is written into the code: new coins are created as a reward for miners who add blocks to the chain, and that reward is cut in half every 210,000 blocks. Because a block arrives about every ten minutes on average, 210,000 blocks take close to four years. That event is the Bitcoin halving, and the price pattern that has formed around it is what people call the four-year cycle.
The cycle usually gets described in four phases. First comes accumulation, when prices are depressed and sentiment is gloomy. Then the halving arrives and new supply drops. Over the following year or so, a bull market builds and often ends in a euphoric peak. Finally, a bear market wipes out most of the speculative excess, and the whole thing starts again.
Nothing in the protocol says prices must follow this script. The halving is a supply event; the price reaction depends on demand, leverage, liquidity and human psychology. That is why it is better to treat the cycle as a historical tendency than as a law.
How the Bitcoin Halving Works
Blocks, rewards and the 21 million cap
When Bitcoin launched in 2009, miners received 50 BTC per block. The reward fell to 25 BTC in November 2012, to 12.5 BTC in July 2016, to 6.25 BTC in May 2020 and to 3.125 BTC in April 2024 at block 840,000. The next cut, at block 1,050,000, takes it to 1.5625 BTC.
Bitcoin’s difficulty adjustment keeps block times near ten minutes no matter how much computing power joins the network. That is what makes the schedule predictable. With roughly 144 blocks a day, miners currently create about 450 new BTC daily. After the 2028 halving that drops to around 225 BTC per day. Because the series of halvings converges, total supply can never exceed 21 million coins, and more than 20.1 million already exist.
Why a supply cut can move the price
The classic argument is simple. Miners have bills to pay in dollars, so they sell a large share of their new coins. When the reward halves, that steady stream of sell pressure halves too. If demand stays the same, fewer coins are available to buy, and price has to rise to balance the market.
The effect is real but shrinking. In 2012 the halving removed a meaningful slice of annual new supply relative to the coins in circulation. Today new issuance is well under 1% of supply per year, and after 2028 it falls to roughly 0.4%. Compared with daily trading volume and ETF flows, the halving cut now looks small. That is the core of the “diminishing returns” debate covered below.
The reflexive part: narrative
There is also a softer channel. Because so many investors believe in the cycle, they buy ahead of the halving and sell a year or so after it. Media coverage, social posts and price models built on the halving all reinforce each other. Part of the cycle may be self-fulfilling, which also means it can fade as more people try to front-run it.
Bitcoin Cycle History: Every Halving Compared
The table below lines up every completed cycle. Prices are rounded, because exchanges and data providers report slightly different highs and lows. For example, the 2014–2015 drawdown appears anywhere from about 82% to 88% depending on the feed.
Bitcoin halving cycles, 2012–2028
Historical| Halving | Block reward | Price at halving | Prior cycle low | Cycle peak | Peak date | Gain low → peak | Drawdown after peak |
|---|---|---|---|---|---|---|---|
| Nov 28, 2012 | 50 → 25 BTC | ~$12 | ~$2 (Nov 2011) | ~$1,150 | Late Nov 2013 | ~575x (~57,000%) | ~86% (Jan 2015) |
| Jul 9, 2016 | 25 → 12.5 BTC | ~$650 | ~$170 (Jan 2015) | ~$19,700 | Dec 17, 2017 | ~115x (~11,500%) | ~84% (Dec 2018) |
| May 11, 2020 | 12.5 → 6.25 BTC | ~$8,600 | ~$3,200 (Dec 2018) | ~$69,000 | Nov 10, 2021 | ~21x (~2,050%) | ~77% (Nov 2022) |
| Apr 20, 2024 | 6.25 → 3.125 BTC | ~$63,800 | ~$15,500 (Nov 2022) | ~$126,080 | Oct 6, 2025 | ~8x (~710%) | ~54% so far (Jun 30, 2026 low) |
| ~Apr 2028 (est.) | 3.125 → 1.5625 BTC | n/a | To be confirmed | n/a | n/a | n/a | n/a |
Rounded figures from CoinDesk, CoinGecko and NYDIG data; highs and lows differ slightly by exchange. The 2026 low of ~$57,700 is not confirmed as the cycle bottom.
Cycle one: the first halving (2012–2015)
Bitcoin was still a niche experiment when the reward first dropped to 25 BTC. It had already lived through a bubble in 2011, peaking around $31 in June before collapsing to about $2 by November. After the 2012 halving, price climbed past $1,000 in late 2013. Then the Mt. Gox exchange halted withdrawals in February 2014 and later collapsed, dragging Bitcoin into a bear market that bottomed in January 2015.
Cycle two: the ICO era (2016–2018)
The second halving coincided with the rise of Ethereum and the initial coin offering boom. Bitcoin ran from roughly $650 at the halving to nearly $20,000 in December 2017, while thousands of new tokens launched. The unwind was brutal: about 84% off the top by December 2018.
Cycle three: zero rates and institutions (2020–2022)
The 2020 halving arrived two months after the COVID crash, when the Fed cut rates to zero and launched large-scale bond buying. Public companies began buying Bitcoin for their balance sheets, and price peaked near $69,000 in November 2021. Fed rate hikes in 2022, plus the Terra, Celsius and FTX collapses, took BTC down roughly 77%.
Cycle four: the ETF cycle (2024–2026)
Spot Bitcoin ETFs began trading in the US on January 11, 2024, three months before the halving. For the first time, Bitcoin broke its previous all-time high before the halving, in March 2024. The cycle top came on October 6, 2025 near $126,080. Days later, on October 10–11, more than $19 billion of leveraged positions were liquidated, the largest such event on record. Bitcoin then slid to a 2026 low of roughly $57,700 around June 30, about 54% below the peak.
Timing Patterns: Halving to Peak, Peak to Bottom
The timing has been more stable than the size of the moves. The last three halvings each led to a peak 17–18 months later, and each bear market lasted about a year from top to bottom.
How long each cycle phase lasted
| Cycle | Halving → peak | Peak → bottom | Bottom → next halving |
|---|---|---|---|
| 2012 halving | 367 days | ~411 days | ~18 months |
| 2016 halving | 526 days | ~363 days | ~17 months |
| 2020 halving | 548 days | ~376 days | ~17 months |
| 2024 halving | 534 days | 267 days to the Jun 2026 low* | ~22 months if that low holds |
*Not confirmed as the cycle bottom. Peak-to-bottom durations per NYDIG data.
A second regularity is less discussed: from each cycle bottom to the next cycle peak took close to three years. January 2015 to December 2017, December 2018 to November 2021 and November 2022 to October 2025 all fit that window. If the mid-2026 low turns out to be this cycle’s bottom, the same spacing would point to a peak in 2029. That is pattern-matching, not a forecast, and it rests on a sample of three.
Diminishing Returns: Why Each Cycle Gains Less
Look at the multiples: roughly 575x, then 115x, then 21x, then 8x from cycle low to cycle peak. Measured from the price on halving day, the drop-off is even sharper. Bitcoin rose about 93x after the 2012 halving, about 30x after 2016, about 8x after 2020 and only about 2x after 2024.
Three forces explain the decay:
- A smaller supply shock. Each halving removes half as many new coins as the one before, and those coins are a smaller share of the total in existence.
- A bigger asset. Moving a trillion-dollar market cap by 10x requires vastly more new money than moving a billion-dollar one. Larger assets naturally grow more slowly.
- Less fragile ownership. Long-term holders, ETFs and corporate treasuries now hold a large share of supply. That dampens both the euphoria and the panic.
The flip side is good news for risk. Bear-market drawdowns have shrunk too: about 86%, then 84%, then 77%, and roughly 54% so far in this cycle. A gentler cycle in both directions is exactly what you would expect from a maturing asset. Tools like the Bitcoin rainbow chart try to capture this flattening curve with logarithmic bands.
Thinking in cycles, not days?
Many long-term investors build a position gradually during quiet phases of the cycle instead of chasing peaks. Only invest what you can afford to lose.
Is the 4-Year Cycle Broken?
This is the big debate, and both sides have evidence.
Arguments that the cycle still works
- The timing held. The 2025 peak arrived 534 days after the halving, right in the historical window.
- The bear market showed up on schedule. A sharp reversal followed the peak, with a roughly year-long decline into mid-2026, much like 2014, 2018 and 2022.
- Behavior repeats. Leverage built up into the top and was flushed out violently in October 2025, a familiar late-cycle pattern.
Arguments that it is fading
- ETFs changed who buys. Spot Bitcoin ETFs have taken in roughly $56 billion of net inflows since January 2024, according to SoSoValue. Their flows now swing price more than miner selling does. Our crypto ETF analysis covers how much they really move the market.
- Macro dominates. In 2026 the Fed went from cutting to hiking, with a 25-basis-point increase in September. Rate expectations and dollar liquidity now explain more of Bitcoin’s path than block rewards do. See how Fed interest rates affect Bitcoin.
- The top was muted. The 2025 peak came without the broad retail mania and altcoin frenzy of 2017 or 2021. Bitcoin dominance stayed high and many altcoins never reclaimed their old highs.
- The halving is now small. Annual issuance is below 1% of supply, and after 2028 it drops to roughly 0.4%.
Our view: the cycle is no longer a supply story so much as a liquidity-and-psychology story that happens to share the halving’s calendar. As long as enough investors believe in it and the Fed’s policy cycle loosely lines up, the four-year rhythm can persist. But it is likely to keep getting flatter, and it could break the moment a strong macro force pushes against it.
Where the Current Cycle Stands
As of early November 2026, Bitcoin trades roughly 40% below its October 2025 all-time high, having bounced off the mid-2026 low but failed to hold rallies above $80,000. The Fed funds rate sits at 3.75–4.00% after the September hike, markets are pricing a meaningful chance of another increase at the December 8–9 meeting, and spot ETFs have seen net outflows in October and early November.
In cycle terms this looks like the middle of the post-peak phase. Historically, that window between a bear-market low and the following halving has been choppy and frustrating, with sharp rallies that fail and long sideways stretches. Whether the June 2026 low marks the bottom is the key open question. If prices undercut it, the cycle would look even more like 2014–2015 or 2022, where the final low came late in the bear.
For the live picture, our Bitcoin price prediction page shows short-term technical signals, and the bear market analysis compares this drawdown with every previous one.
What the Pattern Implies Before the 2028 Halving
Our forecasting model includes a halving-cycle overlay: it tilts expected returns upward in the period around and after a halving and downward after the typical peak window. The yearly ranges below combine that overlay with Bitcoin’s long-run growth trend, its current volatility and its position against key moving averages.
Read the cards as a range of algorithmic estimates, not a promise. The model’s average for 2027 is $100,083, rising to $137,890 in the halving year and $153,560 in 2029, which is where the historical peak window falls. For 2030 the average eases to $138,301, reflecting the post-peak correction that every past cycle has shown.
If the historical script repeats, the next 12–18 months would be a base-building phase, followed by improving momentum into the April 2028 halving and a potential cycle top somewhere in 2029. The bear case is that macro headwinds, such as a hiking Fed, persistent ETF outflows or a recession, keep Bitcoin range-bound regardless of the halving. The bull case is that easier policy and fresh institutional demand arrive early and pull the cycle forward, as ETF flows did in 2024.
For a broader take on what triggers a new uptrend, see our crypto bull run prediction. If you want to stress-test a position against these ranges, the crypto profit calculator lets you plug in your own entry and exit prices.
How to Use the Cycle Without Being Fooled by It
The four-year cycle is a useful map, but a bad GPS. A few rules keep it in its place:
- Respect the sample size. Four halvings is not statistics; it is anecdote with a pattern. Each cycle also happened in a different macro world.
- Expect smaller swings. Planning for a 20x or a 90% crash because that is what happened in 2017 ignores the clear trend of shrinking moves.
- Watch liquidity alongside the calendar. A halving during Fed tightening is a different setup from one during easing.
- Use it for pacing, not timing. Many long-term investors use the cycle to decide when to be patient and when to take some profit, rather than to call exact tops and bottoms. Dollar-cost averaging, buying a fixed amount on a schedule, removes the need to time the cycle perfectly.
None of this is financial advice. Our forecasts are algorithmic estimates built from technical analysis and historical data, and the methodology is explained in how crypto price predictions work. For forecasts on other assets that tend to follow Bitcoin’s cycle, browse our crypto price predictions hub.
Frequently asked questions
What is the Bitcoin 4-year cycle?
It is the recurring pattern in which Bitcoin's price has moved in roughly four-year waves tied to the halving, the event that cuts the new-coin reward for miners in half every 210,000 blocks. Historically, a halving was followed by a major peak 12–18 months later, a deep bear market of about a year, and a recovery leading into the next halving.
When is the next Bitcoin halving?
The next halving is expected at block 1,050,000, which trackers currently estimate for mid-April 2028. The exact date moves with block times. At that block the miner reward drops from 3.125 BTC to 1.5625 BTC, cutting daily new issuance from roughly 450 BTC to about 225 BTC.
How long after the halving does Bitcoin peak?
In past cycles the peak arrived 367 days (2012 halving), 526 days (2016), 548 days (2020) and 534 days (2024) after the halving. The last three cycles cluster around 17–18 months, but four data points are a tiny sample and nothing guarantees the timing repeats.
Is the Bitcoin 4-year cycle broken?
Not entirely, but it is weakening. The 2024 cycle still peaked about 534 days after the halving, in line with history. However, the gain was far smaller, the drawdown so far has been milder, and spot ETFs, corporate treasuries and Fed policy now move price more than the shrinking supply cut does.
Why do Bitcoin cycle returns keep getting smaller?
Each halving removes a smaller share of total supply, so the supply shock shrinks. Bitcoin's market cap is also far larger, so every additional dollar of demand moves the price less. The low-to-peak multiple fell from roughly 575x in the first cycle to about 8x in the cycle that peaked in October 2025.
What happens to Bitcoin after the last halving?
Halvings continue until the block reward rounds down to zero, which is expected around the year 2140, when the 21 million cap is effectively reached. After that, miners would be paid only through transaction fees. Long before then, issuance becomes so small that halvings matter little for supply.
Put your research into practice
Compare forecasts, size your position for volatility, then open an account on a licensed exchange.
Keep exploring

Bitcoin Prediction
Bitcoin price prediction for tomorrow, the next 12 months, 2030 and 2040: live BTC price, monthly forecast…

Next Bull Run
When could the next crypto bull run start? The signals we track: liquidity, halving timing, BTC dominance,…
Bear Market Outlook
Every crypto bear market compared: drawdowns, duration and what marked the bottom, plus crash-risk signals to…
Bitcoin Rainbow Chart
Interactive Bitcoin rainbow chart with live price and log-regression bands since 2011. See which color band…

Fed Rates & Bitcoin
How Federal Reserve rate decisions, liquidity and the dollar affect Bitcoin and altcoins, with historical…
Crypto ETFs
How spot crypto ETFs work, how big the flows are and whether they really move prices. Bitcoin, Ethereum,…
Not Financial Advice (NFA). This page is published by an independent analytics portal. Forecasts are generated by algorithms based on technical analysis and historical data; they are estimates with wide error margins, not promises or recommendations. Crypto prices are extremely volatile and you could lose all of your investment. Do your own research and never invest money you cannot afford to lose. Full disclaimer · How our model works