 Ethereum
 XRP
 Solana
 BNB
 Hedera
 Cardano
 Chainlink
 Dogecoin
 Litecoin
 Shiba Inu
 Stellar
 Pepe
 Bonk
 Sui
 Ondo
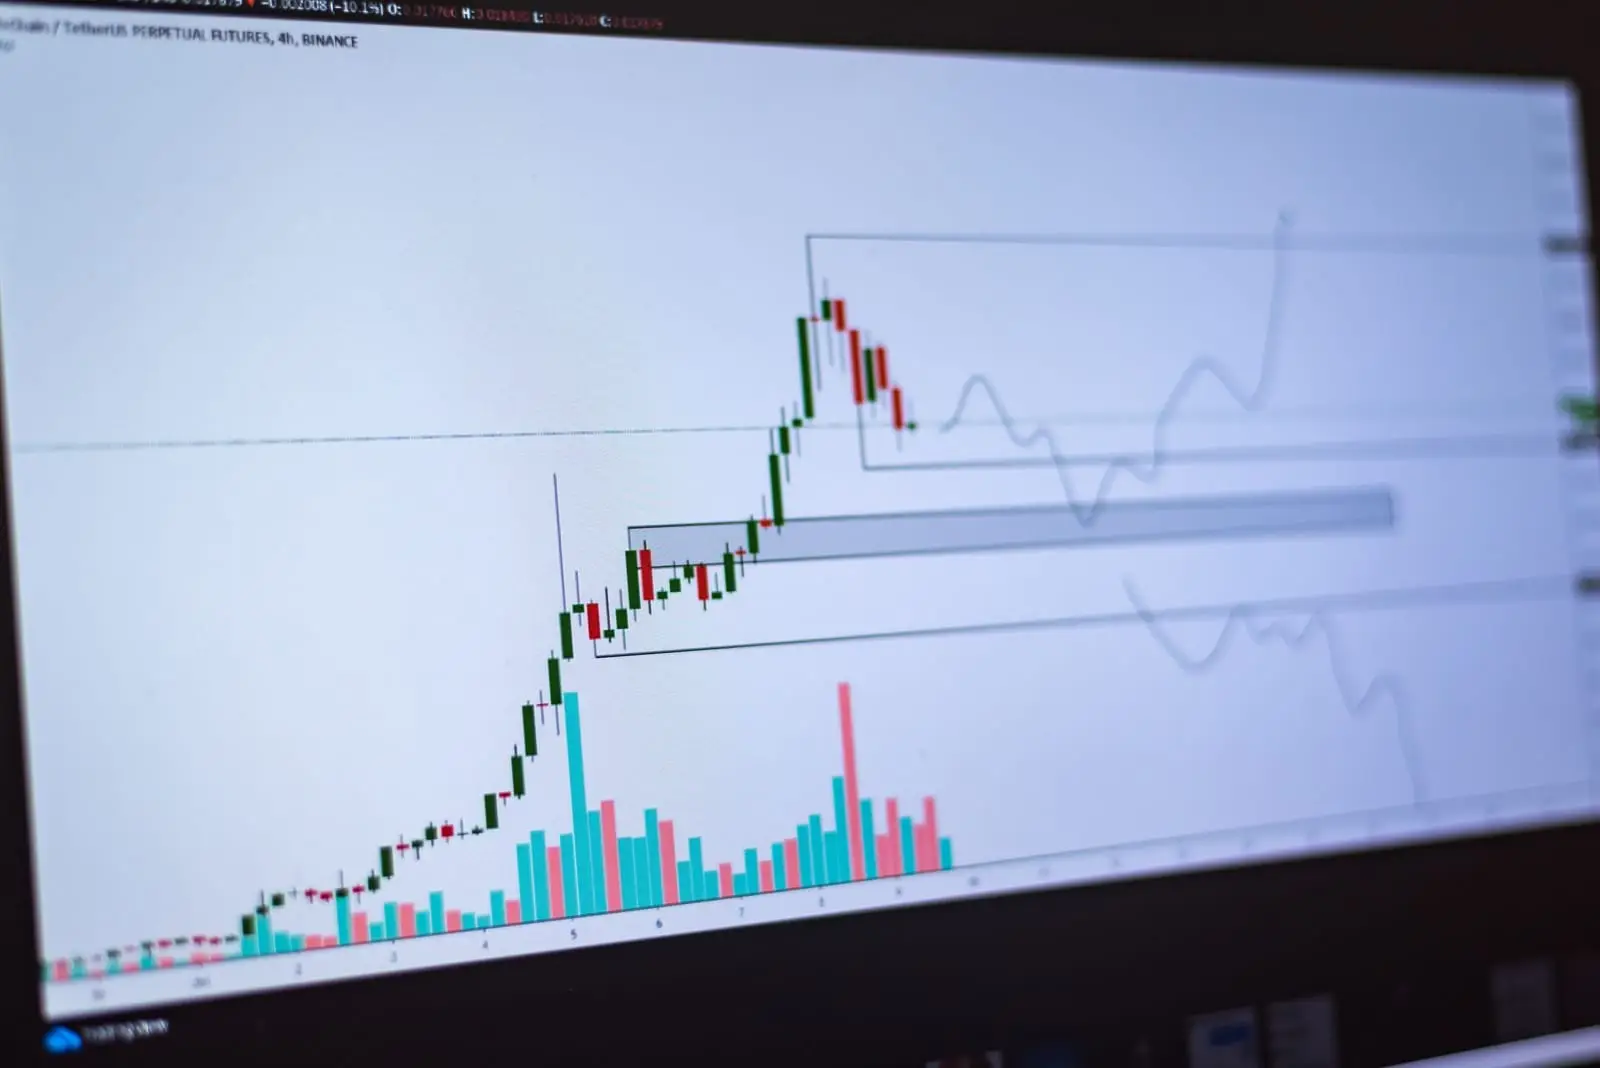
The Bitcoin rainbow chart is one of the simplest ways to see where BTC trades relative to its own long-term history. Instead of asking “where will the price go next week,” it asks a slower question: compared with the growth curve Bitcoin has followed since 2011, is the price today cheap, normal or stretched?
The chart above is our own version, built from scratch. We fit a logarithmic regression to Bitstamp weekly closes, split the historical range into nine colored bands, and mark each halving. The header tells you which band Bitcoin is in today, using a live price when available. This page explains how the chart is built, how to read every band, how BTC behaved in past cycles, and why you should never treat it as a price forecast.
- The chart fits log10 of price against log10 of days since the genesis block, using weekly closes from Bitstamp since 2011.
- Nine equal-width bands cover the full range of historical deviations from that fitted trend, from Deep value to Bubble territory.
- Each cycle peak since 2013 has topped out in a lower band than the previous one, a visible sign of diminishing returns.
- Cycle lows have repeatedly landed in the bottom bands, but timing within a band varied by many months.
- It is a curve fitted to the past. Use it for context alongside other tools, not as a forecast or a trading signal.
What a Bitcoin Rainbow Chart Shows
A regular price chart on a linear scale makes early Bitcoin history invisible: a move from 2 to 30 dollars looks like a flat line next to later prices in the tens of thousands. A logarithmic scale fixes this by giving equal space to equal percentage moves. Going from 10 to 100 dollars takes the same vertical distance as going from 10,000 to 100,000.
A rainbow chart adds one more step. It draws a smooth growth curve through the history, then wraps colored bands around it. When the price line sits in the lower, cooler bands, Bitcoin is trading below its long-run path. When it climbs into the warmer bands, it is trading above that path, often during speculative rallies.
The idea became popular in crypto circles years ago, and many versions now exist with different curves and labels. Ours uses its own regression, its own band boundaries and its own labels, all calculated from the data each time the site is rebuilt.
How Our Rainbow Chart Is Built
Transparency matters more than color for a chart like this, so here is exactly what the code does.
The data
We use Bitcoin’s weekly closing prices in US dollars from Bitstamp, one of the longest-running BTC/USD markets, starting in September 2011. Earlier prices exist but come from thinner, less reliable markets, so we leave them out. The chart note shows how many weekly closes went into the fit.
The regression
Each weekly close becomes one point. On the horizontal axis we take the base-10 logarithm of the number of days since January 3, 2009, the date of Bitcoin’s genesis block. On the vertical axis we take the base-10 logarithm of the price. Then we fit a straight line with ordinary least squares.
The result is a formula of the form: log10(price) equals a constant plus a slope times log10(days since genesis). The fitted constant and slope are printed in the note under the table, so you can check or reproduce the curve yourself. A straight line in log-log space means price follows a power of time. That shape grows quickly in the early years and then more slowly, which is why the curve flattens as it moves right.
The nine bands
Next we measure how far every weekly close sat above or below the fitted line, again in log terms. We take the lowest and highest deviations ever recorded, add a small margin on each side, and divide that range into nine slices of equal width. Each slice becomes a band, drawn parallel to the trend curve.
Because the biggest historical deviation above the line, during the 2013 mania, was larger than the deepest one below it, the fitted trend line itself runs through the lower-middle part of the rainbow rather than through the exact center. The “regression trend line” figure in the header is that fitted line. The band labelled Fair value is the middle slice, which sits somewhat above it.
The table under the chart
The table lists the lower edge of four key bands at the end of each year through 2030: Below trend, Fair value, Heating up and the start of Bubble territory. These are where the bands will sit if the curve keeps its current shape. They are not price predictions; they simply extend the fitted curve forward.

How to Read Each Band
From bottom to top, here is what each band has meant historically. The descriptions are interpretations of past behavior, not rules.
The nine bands of our Bitcoin rainbow chart
| Band | Position vs trend | Historical character |
|---|---|---|
| Deep value | Furthest below the curve | Rare. Reached near the deepest points of bear markets, after long, painful declines. |
| Undervalued | Well below the curve | Typical of late bear markets and early recoveries, when sentiment was poor. |
| Accumulation zone | Slightly below to around the fitted line | Quiet periods where price drifted near trend; often a base-building phase. |
| Below trend | Just above the fitted line | A neutral to mildly warm area where several recent rallies stalled. |
| Fair value | Middle of the rainbow | Price modestly above the line; common in the middle of bull phases. |
| Above trend | Clearly above the curve | Strong uptrends; reached at the 2021 highs. |
| Heating up | Well above the curve | Late-stage rallies with growing speculation. |
| Overheated | Near the historical extremes | Reached around the late-2017 peak. |
| Bubble territory | The very top | Only touched during the 2013 mania in weekly-close data. |
Descriptions based on Bitstamp weekly closes since 2011. Intraweek highs and lows reached further than weekly closes.
Cool bands: Deep value, Undervalued, Accumulation zone
The three blue and teal bands are where the price sits below or near the long-run curve. In past cycles, Bitcoin spent long stretches here during bear markets and early recoveries. The key word is long: price has sat in these bands for many months at a time, and it has dropped from Undervalued into Deep value before bottoming. A low band tells you price is cheap relative to history, not that it has finished falling.
Middle bands: Below trend, Fair value, Above trend
The green and yellow-green bands cover the normal range of a maturing bull market. This is where most of Bitcoin’s weekly closes have been in recent years. Readings here say little on their own; momentum, macro conditions and fund flows tend to matter more in this zone.
Warm bands: Heating up, Overheated, Bubble territory
The orange and red bands have historically appeared only near euphoric peaks. When the price enters these bands, the gap to the trend curve is large enough that a deep correction has followed every time so far. As we explain below, recent peaks have not reached these bands at all.
How Bitcoin Behaved in Past Cycles
The rainbow chart is most interesting when you trace past cycles through it. The patterns below come from our own fit on weekly closes.
Cycle peaks have climbed fewer bands each time
The late-2013 top produced the largest deviation above trend in the data set and defines the top of the Bubble territory band. The December 2017 peak, at roughly 19,000 to 20,000 dollars, reached the Overheated band. The 2021 highs near 69,000 dollars, in both April and November, topped out in Above trend. The October 2025 all-time high of about 126,000 dollars only reached the Below trend band on a weekly-close basis.
That sequence is the clearest message the chart gives: each bull market has peaked closer to the trend line than the one before. It fits the idea of diminishing returns as Bitcoin’s market grows, deepens and draws in larger, slower-moving capital such as spot ETFs. It also means the warm bands may not be reached again, so waiting for “red” before taking profits has become a less reliable plan.
Cycle lows have kept reaching the bottom bands
On the downside, the picture has been more stable. The early-2015 and December 2018 lows both sat in the Undervalued band. The November 2022 low, after the collapse of a major exchange, reached Deep value, as did the mid-2026 low near 58,000 to 60,000 dollars. Bear markets have kept pushing price well below the curve even as bull markets have stretched less above it.
What the asymmetry suggests
Put the two observations together and the trend curve looks increasingly optimistic. If recent peaks barely clear the fitted line while lows still fall far below it, the “true” long-run path may be bending lower than a single straight log-log line can capture. That is a known weakness of power-law fits, and the reason we encourage reading the chart alongside the Bitcoin 4-year cycle analysis and our crypto bear market guide.
Criticism and Limits of the Rainbow Chart
Rainbow charts are popular because they are easy to read. That same simplicity hides real weaknesses.
It is curve fitting
The regression is fitted to past prices. By construction, it describes them well. There is no economic law that says Bitcoin’s price must follow a power of time, and a curve that matched 15 years of history can drift away from the next 15.
The bands are defined by extremes
Because band edges come from the highest and lowest deviations ever recorded, a single extreme period, especially the 2013 mania, shapes the whole rainbow. If a future crash goes deeper than any before, the bottom edge will move when the chart is rebuilt, and past readings will shift slightly too.
Diminishing returns break a straight line
As shown above, peaks have been falling relative to the curve. A single log-log line cannot capture a growth rate that slows faster than a power law. Some analysts fit curved or segmented models instead; each has its own trade-offs.
It ignores everything except price and time
The chart knows nothing about interest rates, regulation, ETF flows, network activity or the halving schedule. It cannot warn you about a liquidity crunch or a policy shock. For those factors, see our pages on Fed interest rates and Bitcoin and the broader market analysis hub.
It is not a forecast
The table of future band edges extends the curve; it does not predict that price will reach any of those levels. Bitcoin could spend years below the Fair value band or never return to the warm colors.
The rainbow chart summarises where Bitcoin has traded relative to one fitted trend. It does not account for news, macro conditions or changes in market structure. Nothing on this page is financial advice.
How to Combine the Rainbow Chart With Other Tools
The chart works best as a slow-moving backdrop. Here is how we suggest pairing it with the rest of the site.
- For a range of near-term outcomes, run Bitcoin through the AI crypto price predictor. It simulates thousands of paths from current volatility and shows a probability band for horizons from a week to 2030.
- For yearly model ranges, our Bitcoin price prediction page shows minimum, average and maximum estimates per year. For example, the model’s 2030 average is $138,301. Comparing those ranges with the band edges in the rainbow table is a useful cross-check: when the two very different methods disagree, uncertainty is high.
- For position sizing, use the crypto profit calculator to see what a move to the lower or upper edge of a band would mean for your investment after fees, and its DCA tab to see how regular buying fared through past low-band periods.
- For methodology, our how crypto price predictions work page explains the forecast model, which is separate from this regression.
A sensible way to use the chart is as a check on your emotions. When the price sits in a cool band and headlines are gloomy, the chart is a reminder of how past lows looked. When it climbs into the upper bands and everyone is euphoric, it is a reminder that every past stretch above trend ended in a large correction.
How Often the Chart Updates
The regression, the band edges and the table are recalculated whenever the site’s market data is refreshed and the pages are rebuilt. Each rebuild adds the latest weekly closes to the fit, so the constant and slope can shift slightly over time. Because the fit already covers more than a decade of data, a few new weeks rarely change the picture much.
The header works differently. When your browser can reach a live price feed, it recalculates the band and the regression trend line for today’s date using the live BTC price. If the feed is unavailable, it falls back to the latest weekly close in the data set. Either way, the band shown at the top is the one to trust, rather than any band mentioned in an article or social media post written on a different day.
Frequently asked questions
What is the Bitcoin rainbow chart?
It is a long-term valuation chart that draws Bitcoin's price on a logarithmic scale and overlays colored bands around a fitted growth curve. Cooler colors at the bottom mark periods when price was low relative to its historical trend; warmer colors at the top mark periods when it was stretched. It is a visual summary of the past, not a forecasting model.
How is this rainbow chart calculated?
We fit a straight line to the base-10 logarithm of Bitcoin's weekly closing price against the base-10 logarithm of days since the genesis block on January 3, 2009, using Bitstamp data from September 2011 onward. The range of historical deviations from that line is then split into nine equal slices, which become the bands. The exact fitted coefficients are printed under the chart.
Is the Bitcoin rainbow chart accurate?
It has described past cycles reasonably well, which is expected because it was fitted to them. It is not designed to predict future prices. Each cycle peak since 2013 has landed in a lower band than the one before, which suggests the curve may overstate future growth. Treat it as context, not as a signal.
What band is Bitcoin in right now?
The header above the chart shows the current band, updated with a live price when your browser can reach a price feed. Band positions change as both the price and the date move, because the trend curve keeps rising slowly over time. Check the chart itself rather than relying on any band named in an article.
Why does the trend line rise more slowly over time?
On a log-log fit, a constant slope means price grows as a power of time. Each additional year adds a smaller percentage gain to the trend than the year before. That is how the model captures diminishing returns: the curve keeps rising, but more gently as Bitcoin matures.
Should I buy Bitcoin when it is in the blue bands?
Historically, the lower bands coincided with periods that later looked like good entry points, but that was in hindsight and there is no guarantee the pattern holds. Prices can stay in low bands for many months or fall further. Use the chart as one input alongside your time horizon, risk tolerance and other tools. It is not financial advice.
Put your research into practice
Compare forecasts, size your position for volatility, then open an account on a licensed exchange.
Keep exploring
Bitcoin 4-Year Cycle
Bitcoin’s four-year halving cycle with real numbers from every cycle since 2012, why returns keep shrinking…

Bitcoin Prediction
Bitcoin price prediction for tomorrow, the next 12 months, 2030 and 2040: live BTC price, monthly forecast…
AI Price Predictor
Pick a coin, an amount and a time frame: our AI-style model runs 2,000 simulations on real volatility and…

Our Methodology
How our crypto forecasts are built: data sources, technical indicators, volatility bands, the halving-cycle…
Bear Market Outlook
Every crypto bear market compared: drawdowns, duration and what marked the bottom, plus crash-risk signals to…

Market Analysis
In-depth crypto market analysis: how the Fed, US elections, regulation, ETFs and the halving cycle move…
Not Financial Advice (NFA). This page is published by an independent analytics portal. Forecasts are generated by algorithms based on technical analysis and historical data; they are estimates with wide error margins, not promises or recommendations. Crypto prices are extremely volatile and you could lose all of your investment. Do your own research and never invest money you cannot afford to lose. Full disclaimer · How our model works