 Ethereum
 XRP
 Solana
 BNB
 Hedera
 Cardano
 Chainlink
 Dogecoin
 Litecoin
 Shiba Inu
 Stellar
 Pepe
 Bonk
 Sui
 Ondo
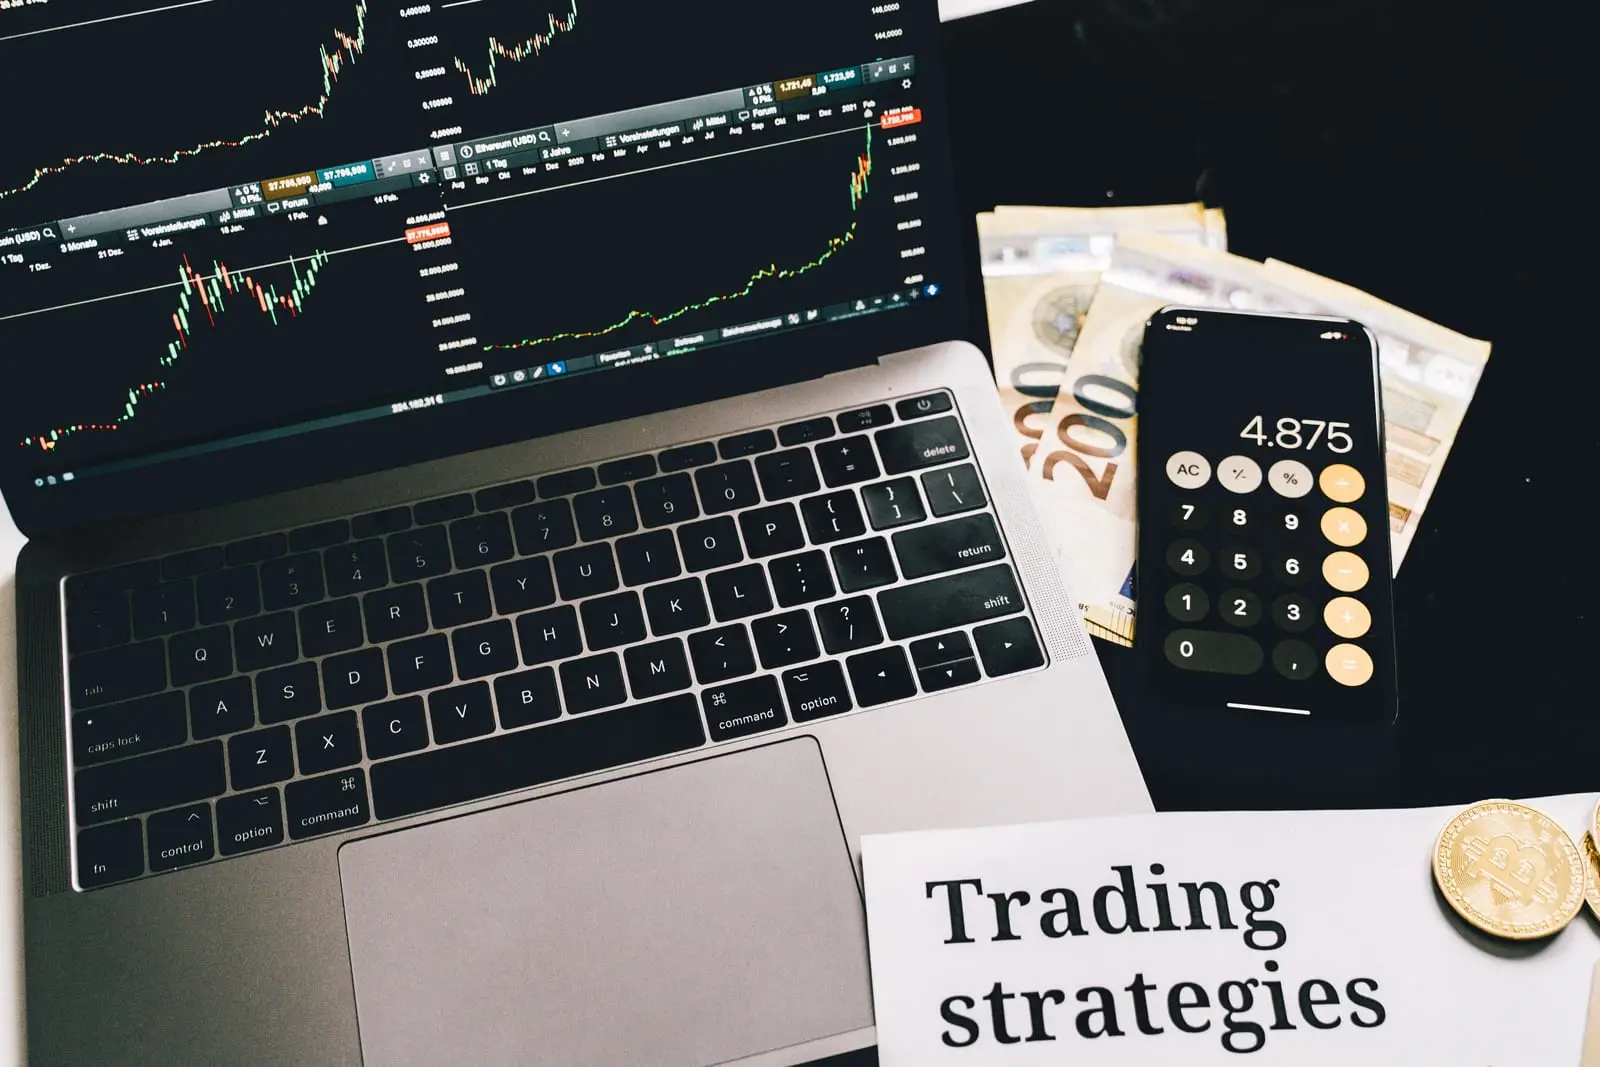
A crypto profit calculator answers a simple question: if I buy at one price and sell at another, what do I actually end up with after fees? The answer is rarely the headline percentage on a price chart. Trading fees on both sides, the number of coins you really receive and the price you need just to break even all change the result.
The tool above has two tabs. Profit & ROI calculates the outcome of a single trade. DCA vs Lump Sum backtests a monthly buying plan against investing everything at once, using real monthly closing prices. This guide walks through the formulas, shows how fees shift your break-even point, and explains how to read the backtest without fooling yourself.
- Profit is calculated on the coins you actually receive after the buying fee, then reduced by the selling fee.
- Break-even equals the buy price divided by one minus the buy fee times one minus the sell fee.
- ROI shows return relative to what you put in; the multiple shows how many times your money you would get back.
- The DCA tab compares a monthly plan with a lump sum on real historical monthly closes. Past results do not predict future returns.
- Taxes are not included. Rules vary by country, so keep records and ask a professional.
How to Use the Crypto Profit Calculator
The Profit & ROI tab updates instantly as you type. There is no button to press.
- Pick a coinChoosing a coin fills in the current price as your buy price and sets a sell price 50% higher as a starting point. Both fields are editable.
- Enter your investmentType the total amount in US dollars you put in, or plan to put in, including the buying fee.
- Set buy and sell pricesUse your real entry if you already own the coin, or a planned entry if you are thinking about a limit order. For the sell price, type a target or use the quick buttons.
- Enter your feesFill in the buy and sell fee percentages charged by your platform. The defaults of 0.25% each side are only an example.
- Try the quick sell targetsThe minus 50%, plus 50%, 2x, 5x and 10x buttons set the sell price relative to your buy price, so you can see a loss scenario and several gain scenarios in seconds.
The results grid shows eight numbers: profit or loss, ROI, final value, break-even price, coins bought, total fees paid, price change and the multiple. The next section explains how each is calculated.
Crypto Profit and ROI Formulas
Every number in the calculator comes from a handful of simple formulas. Knowing them helps you sanity-check results from any app, including the one on your exchange.
Formulas used by the calculator
| Output | Formula | What it tells you |
|---|---|---|
| Coins bought | Investment × (1 − buy fee) ÷ buy price | How many units you actually receive after the buying fee |
| Gross sale value | Coins bought × sell price | What the coins are worth at your sell price, before the selling fee |
| Final value | Gross sale value × (1 − sell fee) | Cash you receive after selling |
| Profit / loss | Final value − investment | Your gain or loss in dollars |
| ROI | Profit ÷ investment × 100 | Return as a percentage of what you put in |
| Multiple | Final value ÷ investment | How many times your money you get back (1.00× = flat) |
| Break-even price | Buy price ÷ ((1 − buy fee) × (1 − sell fee)) | The sell price at which profit is exactly zero |
| Fees paid | Investment × buy fee + gross sale value × sell fee | Total trading fees across both legs |
Fees are entered as percentages and converted to decimals, e.g. 0.25% = 0.0025.
A worked example with round numbers
The following numbers are purely hypothetical and chosen to make the arithmetic easy to follow. Suppose you invest 1,000 dollars in a token at 50 dollars, plan to sell at 75 dollars, and pay 0.25% on each side.
- The buying fee takes 2.50 dollars, so 997.50 dollars buys 19.95 tokens.
- At 75 dollars, those tokens are worth 1,496.25 dollars before the selling fee.
- The selling fee is about 3.74 dollars, leaving roughly 1,492.51 dollars.
- Profit is about 492.51 dollars, an ROI of roughly 49.3%, and a multiple of about 1.49x.
Notice that the price rose 50% but the ROI is a little under 49.3%. That gap is the fees. On a single trade the difference looks small; across dozens of trades a year it compounds into real money.
ROI versus price change
The calculator shows both because they answer different questions. Price change is what the market did. ROI is what happened to your money after costs. If you trade often, track ROI, not price change.
Fees and Your Break-Even Price
Break-even is the sell price where you walk away with exactly what you started with. Because fees are charged on both legs, break-even always sits above your buy price.
With the round example above, a 50-dollar buy and 0.25% on each side gives a break-even of about 50.25 dollars, roughly half a percent higher. Raise the fees to 1% on each side and break-even moves to about 2% above the entry. At 2% on each side, which some instant-buy services charge once spreads are included, you need roughly a 4% rise just to get your money back.
Costs the calculator does not include
The fee fields cover explicit trading fees. In practice you may also face:
- Spreads – the gap between the buy and sell price quoted by a broker-style service, often bigger than the stated fee.
- Payment fees – card purchases usually cost more than bank transfers.
- Network fees – withdrawing coins to your own wallet costs a blockchain fee that varies with network congestion.
- Slippage – large orders in thin markets can fill at worse prices than the last quoted price.
A simple workaround is to add your estimated spread to the fee fields. If your platform quotes a 1% spread and a 0.5% fee, enter 1.5% for the buy side. Our how to buy crypto guide explains how these costs differ between order types and payment methods.

Using It as a Bitcoin Investment Calculator
Many visitors use the tool as a bitcoin investment calculator: “If I put a certain amount into Bitcoin and it reaches a certain price, what would I have?” Select Bitcoin, enter the amount, and type a sell price you want to test.
Two tips make this more useful. First, test more than one sell price. Use the minus 50% button to see what a deep drawdown would do to your position; Bitcoin has fallen more than 50% from its peak in several past cycles, including the drop from about 69,000 dollars in November 2021. Second, avoid picking a target out of thin air. Our Bitcoin price prediction page publishes model ranges for each year, such as a 2030 range from $83,072 to $224,727, and the AI crypto price predictor gives probability-weighted outcomes for your exact amount and horizon. Feed those numbers into this calculator to see the dollar result after fees.
DCA vs Lump Sum: What the Backtest Shows
Dollar-cost averaging, or DCA, means investing the same amount on a regular schedule regardless of price. A lump sum means investing everything at once. The second tab of the calculator compares the two on real data.
How the backtest works
- Choose a coin and monthly amountOnly coins with at least 24 months of monthly price history are listed, so the comparison is meaningful.
- Pick a start monthThe default is about three years back. You can go as far back as the available history allows.
- Set a fee per purchaseEach monthly buy is reduced by this fee.
- Read the resultsThe tool buys at each month’s closing price from your start month, then values all accumulated coins at the current price.
For the lump sum, the tool takes the same total amount you would have invested through DCA and puts it all in at the first month’s close. That makes the comparison fair in dollars, but note that it assumes you had the full amount available on day one.
The results show total invested, DCA value and ROI, your average cost per coin, lump-sum value and ROI, the number of months, and a winner. A small chart traces your DCA portfolio value divided by the amount invested so far; above the dashed line means you were in profit at that point.
Two hypothetical paths
To see why the winner changes, take two simple, invented price paths over three months with 100 dollars a month and no fees.
Hypothetical DCA vs lump sum (illustration only)
| Price path | DCA result | Lump sum result | Winner |
|---|---|---|---|
| 10 → 5 → 10 (dip and recovery) | 40 coins, average cost 7.50, worth 400 (+33%) | 30 coins at 10, worth 300 (0%) | DCA |
| 5 → 10 → 20 (steady rise) | 35 coins, average cost 8.57, worth 700 (+133%) | 60 coins at 5, worth 1,200 (+300%) | Lump sum |
Invented prices for illustration. 300 dollars invested in total in each case.
In the first path, DCA bought cheap coins during the dip and came out ahead. In the second, the lump sum had all its money working from the lowest price. Real markets mix both patterns, which is why the backtest is worth running on several start dates.
Reading backtests honestly
Backtests are easy to over-read. A start date picked right after a crash will flatter almost any strategy; a start near a cycle peak will make both look poor. Try three or four start months, including one near a previous high, before drawing conclusions. The backtest uses monthly closes from Binance spot markets in USDT, so it ignores intra-month swings and slight differences between venues. Past results do not predict future returns. For context on how deep past drawdowns went, see our crypto bear market analysis.
Common Mistakes When Calculating Crypto Profit
These errors come up again and again, even among experienced investors.
- Ignoring fees on the way out. Many people count the buying fee but forget that selling costs money too.
- Comparing price change to ROI. A coin that doubled did not double your money if you bought in several tranches at higher prices.
- Forgetting the denominator. A 100% gain after a 50% loss only brings you back to where you started.
- Mixing realised and unrealised gains. A profit on screen is not cash until you sell, and selling may trigger tax.
- Using a single target. Running only a best-case sell price hides the risk. Always test a downside scenario too.
The last point is the most important. A tool that shows only upside is a marketing tool, not a calculator.
A Note on Crypto Taxes
Taxes can take a large bite out of crypto profit, and this calculator does not estimate them. Rules vary by country and sometimes by state or province. In many places, selling crypto for cash, swapping one coin for another, or spending crypto can each count as a taxable event. Some jurisdictions tax short-term gains at higher rates than long-term holdings; others have different thresholds or exemptions.
What is close to universal is the need for records. Keep a log of every purchase, sale and transfer with the date, amount, price and fee. Most platforms let you export a transaction history. If your situation is anything beyond simple, consult a qualified tax professional in your jurisdiction. Nothing here is tax or financial advice.
Putting the Numbers in Context
A profit calculator tells you what a price move means for your wallet; it does not tell you whether that price is likely. For that, combine it with forward-looking tools. Use the AI crypto price predictor to see a probability range, check the Bitcoin rainbow chart for a long-term valuation view, and browse our crypto price predictions for model ranges across many coins. Then come back here and turn those ranges into dollars, after fees, for the amount you are actually considering.
Frequently asked questions
How do I calculate crypto profit?
Work out how many coins you bought after the buying fee (investment times one minus the fee, divided by the buy price). Multiply that by the sell price, subtract the selling fee, then subtract your original investment. The result is your profit or loss in dollars. Divide it by the original investment to get ROI as a percentage.
What is a good ROI in crypto?
There is no universal benchmark, because crypto returns swing far more than stocks or bonds. A better question is whether the return was worth the risk you took and how it compares with simply holding Bitcoin over the same period. A trade that earned 20% but risked a 70% drawdown may have been a poor bet even though it ended green.
How do fees affect my break-even price?
Fees are charged on both the buy and the sell, so the price must rise slightly above your entry before you make any money. With 0.25% on each side, break-even is about 0.5% above the buy price; with 1% on each side, it is about 2% higher. Spreads and network withdrawal fees can push it higher still.
Is DCA better than a lump sum investment?
It depends on the path the price takes. In a steadily rising market, a lump sum invested at the start usually wins because more money is exposed to the rise. In a choppy or falling market, DCA often wins because later purchases happen at lower prices. The DCA tab lets you test both on real historical data.
Can I use this as a bitcoin investment calculator?
Yes. Select Bitcoin, enter how much you would invest and your expected buy and sell prices, and the calculator shows profit, ROI, fees and the number of BTC bought. Switch to the DCA tab to see what a monthly Bitcoin purchase plan would have returned from any start month in the available history.
Do I have to pay tax on crypto profits?
In many countries, selling, swapping or spending crypto at a profit can be a taxable event, and the rules differ widely between jurisdictions. Some treat crypto as property, others have special regimes or holding-period exemptions. This calculator does not estimate tax. Keep records of every trade and consult a qualified tax professional where you live.
Put your research into practice
Compare forecasts, size your position for volatility, then open an account on a licensed exchange.
Keep exploring
AI Price Predictor
Pick a coin, an amount and a time frame: our AI-style model runs 2,000 simulations on real volatility and…
How to Buy Crypto
Buy your first Bitcoin or altcoin safely: choosing a licensed exchange, verification, payment methods, fees,…

Bitcoin Prediction
Bitcoin price prediction for tomorrow, the next 12 months, 2030 and 2040: live BTC price, monthly forecast…
Bear Market Outlook
Every crypto bear market compared: drawdowns, duration and what marked the bottom, plus crash-risk signals to…

All Predictions
Compare long-term crypto price predictions for 24 major coins side by side: 1-year, 2030 and 2040 model…
Not Financial Advice (NFA). This page is published by an independent analytics portal. Forecasts are generated by algorithms based on technical analysis and historical data; they are estimates with wide error margins, not promises or recommendations. Crypto prices are extremely volatile and you could lose all of your investment. Do your own research and never invest money you cannot afford to lose. Full disclaimer · How our model works