 BNB
 Hedera
 Cardano
 Chainlink
 Litecoin
 Shiba Inu
 Stellar
 Pepe
 Bonk
 Sui
 Ondo
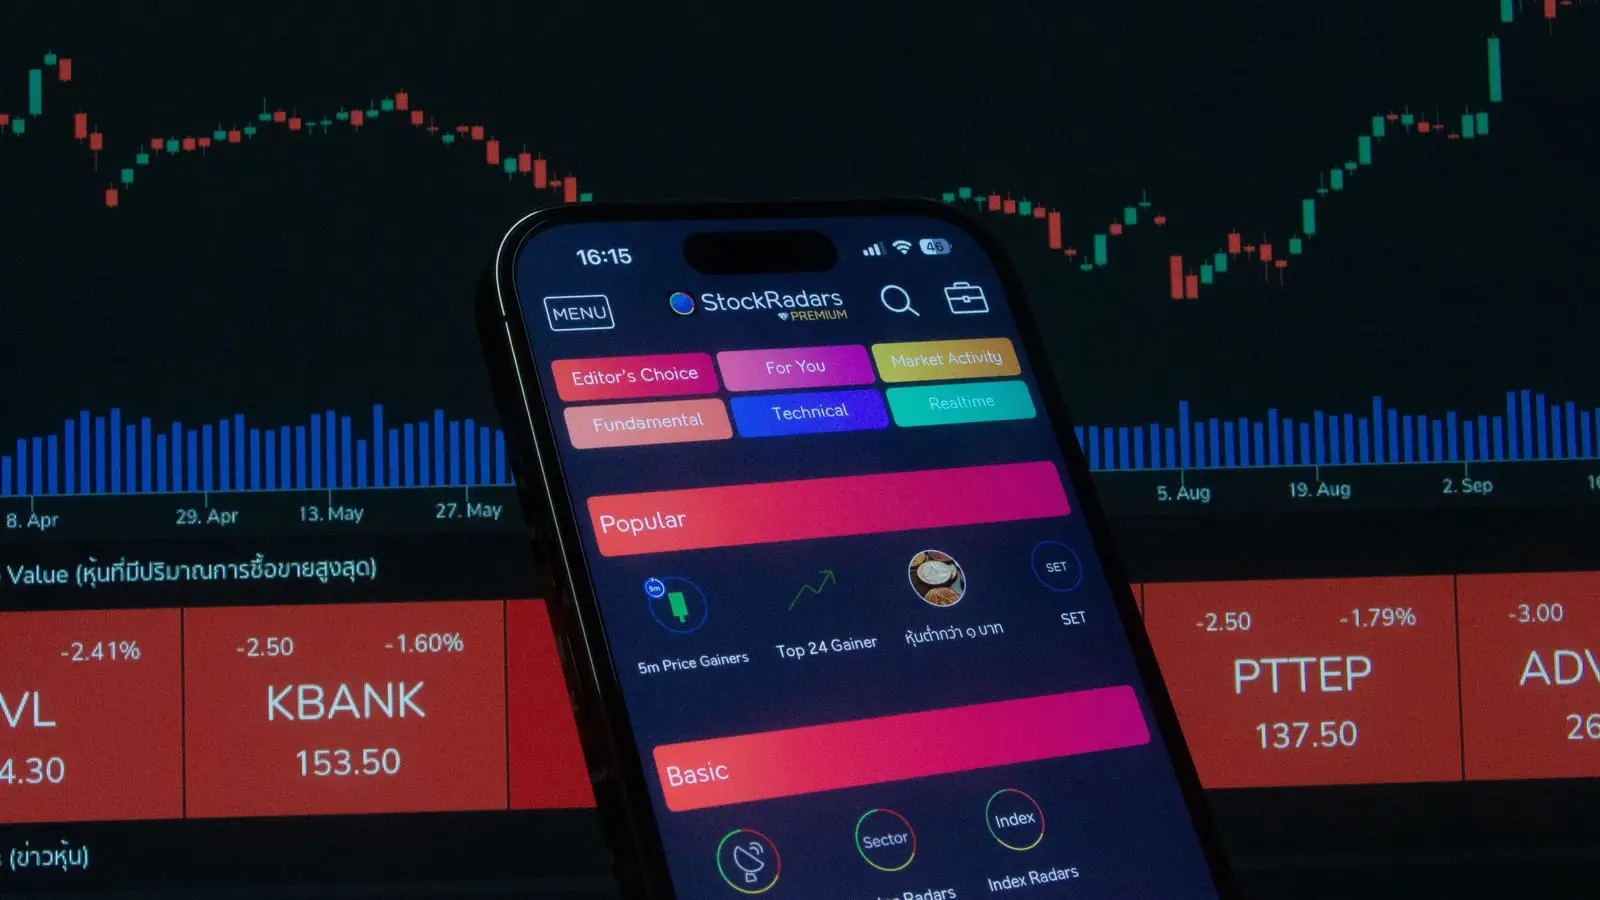
Why is crypto down? It is the most searched question every time the market turns red, and the answer is rarely mysterious. Behind nearly every sell-off sit the same eight recurring forces: macro data and the Fed, forced liquidations, ETF outflows, regulation, hacks, big holders selling, risk-off moves in stocks and plain fear.
This page explains each driver in plain English, shows the live market mood and prices of the largest coins, and includes a dated snapshot of what has been moving prices in early November 2026. Use it to tell the difference between noise, a correction and something bigger.
- Most crypto sell-offs combine two or three drivers, not one.
- Leverage turns ordinary dips into crashes by forcing automatic selling.
- Crypto now reacts strongly to Fed expectations, ETF flows and tech stocks.
- Altcoins usually fall harder than Bitcoin in any sell-off.
- A falling price is not automatically a bear market: trend, flows and sentiment tell you which it is.
Why Is Crypto Down? The Short Answer
Crypto prices fall when more people want to sell than buy at current prices, and crypto is unusually prone to sudden selling. Markets trade 24/7, much of the activity is leveraged, and sentiment can turn on a single headline. A modest shift in demand can therefore produce an outsized move.
The useful question is not just “why is it down?” but “which kind of selling is this?” Selling caused by forced liquidations often reverses quickly once the leverage is gone. Selling caused by tighter monetary policy or sustained fund outflows tends to last longer. The eight drivers below help you sort one from the other.
What’s Driving the Crypto Market Right Now
Here is the live mood and the latest prices for the largest coins. The gauge shows the Crypto Fear & Greed Index when its data feed is available.
Source: Alternative.me. 0–24 extreme fear, 25–44 fear, 45–55 neutral, 56–75 greed, 76–100 extreme greed. Sentiment is a context signal, not a timing tool.
Major coins: live prices and model outlook
Model ranges · NFA| Coin | Price | 1-year avg. | 2030 avg. | 2030 ROI | Signal |
|---|---|---|---|---|---|
 Bitcoin BTC | $76,008 | $95,864 | $138,301 | +82% | Neutral |
 Ethereum ETH | $2,236 | $2,856 | $3,922 | +75% | Neutral |
 XRP XRP | $1.20 | $1.54 | $1.89 | +57% | Neutral |
 Solana SOL | $90.05 | $116.89 | $153.81 | +71% | Bullish |
 Dogecoin DOGE | $0.0722 | $0.0950 | $0.1025 | +42% | Bearish |
Signal = 50/200-day moving averages + RSI(14). Averages are model estimates, not targets.
Snapshot: early November 2026
This section is a dated snapshot and will age. The drivers further down the page are evergreen.
In early November 2026, crypto was under pressure from several directions at once. Bitcoin had dipped below $76,000 early on November 4 as a Democratic sweep in the US midterm elections became clear, then bounced back to around $80,000. The relief did not last. By November 6 Bitcoin was back near the mid-$70,000s, down about 6% in 24 hours, and roughly 40% below its October 2025 all-time high.
Three things drove the latest leg down. First, a tech-led sell-off in US stocks dragged risk assets lower. Second, more than $1 billion of leveraged crypto positions were liquidated, according to reports. Third, spot Bitcoin ETFs recorded a net outflow of about $430 million on November 5, after roughly $515 million left in October.
The backdrop matters too. The Fed raised rates in September 2026 and held at 3.75–4.00% on October 28, with markets pricing a high chance of another hike at the December 8–9 meeting. September inflation came in at 3.7% year over year, pushed up by oil prices linked to the US–Iran conflict. The CLARITY Act market-structure bill remains stalled in the Senate. The Fear & Greed Index sat in the Fear zone. For the political angle, see our midterm elections crypto impact analysis.
Macro, Leverage and Flows: The Big Four Drivers
1. Macro data and the Fed
Interest rates are the price of money. When the Federal Reserve raises rates, or markets expect it to, holding cash and bonds becomes more attractive and speculative assets lose appeal. Crypto has become very sensitive to this. The zero-rate era of 2020–2021 fueled the biggest bull run in its history, and the hiking cycle that started in March 2022 coincided with a 77% Bitcoin drawdown.
That is why inflation reports, jobs data and Fed meetings can move crypto within minutes. A hotter-than-expected CPI print raises the odds of tighter policy, and Bitcoin often drops on the release. Our explainer on Fed interest rates and Bitcoin goes deeper into the transmission channels.
2. Liquidations and leverage
Many crypto traders use borrowed money through futures and perpetual contracts. If price moves against them far enough, the exchange closes their position automatically, a liquidation. Each forced sale pushes price lower, which triggers the next layer of liquidations. This cascade is why crypto can fall 10% in an hour without any real news.
The record example came on October 10–11, 2025, when a tariff announcement set off more than $19 billion of liquidations, the largest on record. A useful tell: if open interest (the total size of open futures bets) collapses during a sell-off, the move was largely forced selling, and those often stabilize faster.
3. ETF outflows
Spot Bitcoin ETFs launched in the US in January 2024, and spot ETFs for Ethereum, Solana, XRP and others followed. These funds must buy or sell the underlying coins when investors put money in or take it out. Long streaks of outflows mean real, steady selling pressure, unlike a one-day liquidation spike. Over May and June 2026, spot Bitcoin ETFs saw roughly $7.2 billion of outflows, during one of the weakest stretches of the year. Track the trend in our crypto ETF analysis.
4. Risk-off moves in equities
When stock markets sell off, especially tech, crypto usually falls with them. Large investors hold both and cut risk across the board. In 2026, analysts also pointed to capital rotating out of crypto and into AI-related stocks, which offered a competing high-growth story. When the Nasdaq has a bad day, expect crypto to have a worse one.
Prefer a plan over panic?
Volatility is normal in crypto. Some investors use sell-offs to buy gradually in small amounts. Never invest more than you can afford to lose.
Regulation, Hacks, Big Sellers and Fear
5. Regulation and policy shocks
Crypto reacts sharply to rules that could limit who can buy, sell or build. In 2021, China’s crackdown on mining and its declaration that crypto transactions were illegal contributed to steep declines. In the US, the 2023 lawsuits against major trading platforms, which labeled several large altcoins as securities, knocked those tokens down sharply. Today the bigger issue is uncertainty: the CLARITY Act, which would clarify which regulator oversees which tokens, passed the House in July 2025 but failed a key Senate vote in September 2026. Read more in our CLARITY Act analysis.
6. Hacks, exploits and collapses
Security failures damage trust and can force sales of stolen funds. Mt. Gox’s collapse in 2014 helped trigger a long bear market. In February 2025, attackers stole roughly $1.5 billion of ETH from a major exchange in one of the largest crypto thefts ever, an attack widely attributed to North Korea’s Lazarus Group. Collapses from fraud or bad risk management, such as Terra and FTX in 2022, have been even more damaging.
7. Whales, governments and miners selling
Large holders can move markets. In mid-2024, the German state of Saxony sold roughly 50,000 seized BTC, and Mt. Gox began repaying creditors in Bitcoin, both of which weighed on prices for weeks. Miners also sell regularly to pay costs, and after each halving cuts their income, weaker miners may be forced to sell reserves. In 2026, reports (not all of them confirmed) that some companies holding Bitcoin as a treasury asset were trimming positions added to the worry.
8. Sentiment and fear
Fear spreads fast in a market dominated by retail traders and social media. A scary headline, a large wallet moving coins or a sharp drop can trigger a wave of selling that feeds on itself. The Crypto Fear & Greed Index tries to measure this mood. Readings in “extreme fear” have often appeared near short-term lows, but fear can also persist for months during a bear market.
Why Altcoins Fall Harder Than Bitcoin
In almost every sell-off, Bitcoin falls least and smaller coins fall most. Altcoins have less liquidity, so the same dollar amount of selling moves the price further. Investors also treat them as the riskiest part of their portfolio and sell them first. Many face extra supply from scheduled token unlocks regardless of market conditions.
Ethereum, XRP and Solana typically drop more than Bitcoin, and meme coins like Dogecoin drop more still. The live table above makes this visible on any red day. If you want to compare outlooks across categories, our Bitcoin price prediction and meme coin predictions pages show how differently the model treats each.
How Long Do Crypto Sell-Offs Usually Last?
It depends on which driver is in charge. Liquidation-driven crashes are fast and often partly reverse within days, because once leveraged positions are gone, the forced selling stops. The March 12, 2020 crash, when Bitcoin lost about 37% in a single day, was largely recovered within a couple of months once the Fed stepped in.
Sell-offs driven by monetary policy or steady fund outflows are slower and more stubborn. They grind on for months, with relief rallies that fail at lower levels. The 2022 decline lasted about a year from top to bottom, and the current downturn that began in October 2025 had already run for most of a year by its mid-2026 low.
Shock events like hacks or exchange collapses sit in between. The initial drop is sharp, but the real damage comes if the event reveals wider problems, as FTX did in November 2022. A practical rule: the more the cause is about money leaving the system rather than a single bad headline, the longer the recovery tends to take.
How to Tell a Dip From a Bear Market
A single red week is not a trend change. A few checks help separate a correction from something deeper:
- Trend: Is Bitcoin holding above its 200-day moving average, or has it been below a falling 200-day for weeks?
- Flows: Are ETF outflows a one-off, or a multi-week streak? Is stablecoin supply shrinking?
- Leverage: Did open interest collapse (a flush that may be over), or is it still rising (more risk ahead)?
- Macro: Has anything changed about the Fed outlook, or is this market noise?
- Breadth: Are all coins down, or only a few with specific problems?
When most of these answers lean negative for weeks, you are likely dealing with a bear market rather than a dip. Our crypto bear market page compares every major downturn and the signals that marked the bottom.
What to Do When Crypto Is Down
There is no single right move, and nothing here is financial advice. But a few habits protect investors during sell-offs:
- Avoid decisions in the first hour of a crash. Liquidation cascades often overshoot and partly reverse.
- Check your exposure, not just the price. If a further 50% drop would force you to sell, your position may be too big.
- Skip leverage. It is the main reason dips become personal disasters.
- Consider gradual buying. Dollar-cost averaging, buying small fixed amounts on a schedule, removes the pressure to pick the exact bottom.
Our model’s average estimate for Bitcoin one month out is $76,608, and for 2027 it averages $100,083. These are algorithmic estimates based on technical analysis and historical data, and the ranges are wide. For a look at what would have to change for the next sustained rally, read our crypto bull run prediction.
Frequently asked questions
Why is crypto down today?
Daily crypto drops usually come from one of a few sources: macro news such as inflation data or Fed comments, a wave of forced liquidations of leveraged positions, outflows from spot Bitcoin ETFs, a sell-off in tech stocks, or a crypto-specific shock like a hack. Often several hit at once. Check the live snapshot on this page and our dated notes on recent drivers.
Why is crypto down in 2026?
Analysts point to several overlapping causes: the record liquidation event of October 2025, persistent spot ETF outflows, a rise in inflation linked to higher oil prices, a Fed that raised rates in September 2026 instead of cutting, money rotating into AI stocks and a stalled US crypto market-structure bill. These are explanations offered by analysts, not proven single causes.
Why does crypto fall when stocks fall?
Since 2020, Bitcoin has often traded like a high-risk tech stock. Many of the same investors and funds hold both, so when they cut risk, they sell crypto along with growth stocks. Crypto also trades around the clock, so it can react first when markets are closed elsewhere. The correlation is not constant, but it tends to rise during sell-offs.
Why do altcoins drop more than Bitcoin?
Altcoins are smaller, less liquid and more speculative, so the same amount of selling moves their price further. Investors also cut the riskiest holdings first in a downturn. Many altcoins face extra supply from token unlocks. As a result, a 10% Bitcoin drop often comes with 15–30% falls in smaller coins.
Is it a good time to buy when crypto is down?
Nobody can say for sure. Buying dips worked well for Bitcoin over long periods, but some declines turned into year-long bear markets, and many altcoins never recovered. If you buy, consider small, regular amounts rather than one large purchase, avoid leverage and only use money you can afford to lose. This is not financial advice.
Will crypto recover?
Bitcoin has recovered from every previous crash and bear market so far, typically reaching new highs within two to three years of a cycle bottom. Many individual altcoins have not. Past recoveries were driven by easier monetary policy, new investor products and the halving cycle; whether those forces return is uncertain.
Put your research into practice
Compare forecasts, size your position for volatility, then open an account on a licensed exchange.
Keep exploring
Bear Market Outlook
Every crypto bear market compared: drawdowns, duration and what marked the bottom, plus crash-risk signals to…

Next Bull Run
When could the next crypto bull run start? The signals we track: liquidity, halving timing, BTC dominance,…
Fed Rates & Bitcoin
How Federal Reserve rate decisions, liquidity and the dollar affect Bitcoin and altcoins, with historical…
Crypto ETFs
How spot crypto ETFs work, how big the flows are and whether they really move prices. Bitcoin, Ethereum,…
Bitcoin Prediction
Bitcoin price prediction for tomorrow, the next 12 months, 2030 and 2040: live BTC price, monthly forecast…

Midterms & Crypto
How the 2026 US midterm results could shape crypto: Congress control, the CLARITY Act, pro-crypto races and…
Not Financial Advice (NFA). This page is published by an independent analytics portal. Forecasts are generated by algorithms based on technical analysis and historical data; they are estimates with wide error margins, not promises or recommendations. Crypto prices are extremely volatile and you could lose all of your investment. Do your own research and never invest money you cannot afford to lose. Full disclaimer · How our model works